Product: Insights
Analyze Your Marketing
Gain a comprehensive understanding of your marketing performance with detailed graphs and metrics. Visualize the big picture of your marketing efforts, explore interactions between channels, and uncover the weights and influences of each channel in your overall strategy.
Complete view of your marketing performance
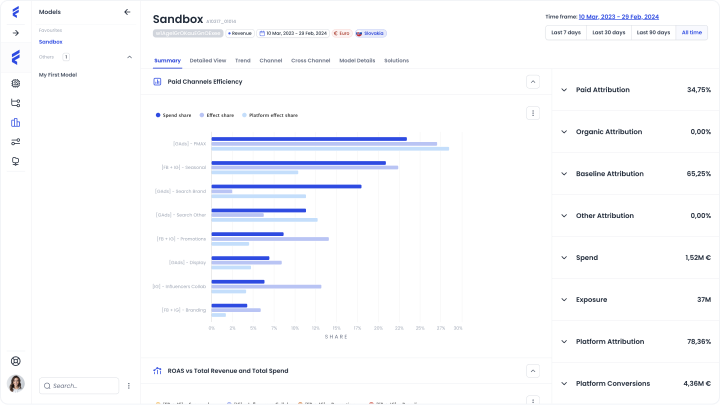
In the Insights section, access essential metrics and charts from your MMM model to understand the big picture of your marketing efforts. See how each channel contributes and interacts within your overall strategy.
Summary overview
Explore key metrics and charts like Paid Channels Efficiency, ROAS vs. Total Revenue and Total Spend, and Overall Attribution. Get a snapshot of your overall marketing performance and effectiveness.
Detailed channel analysis
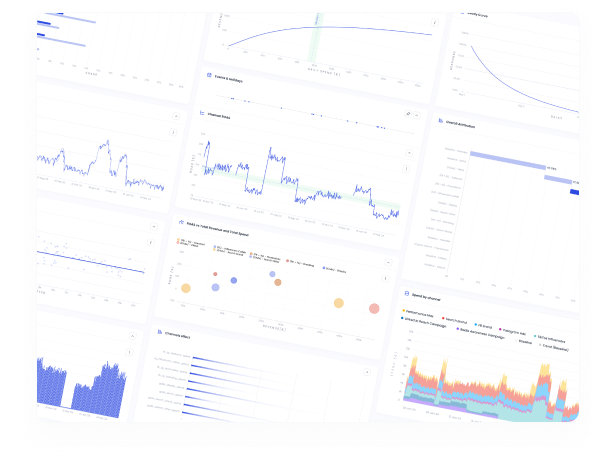
Delve into specific channels with metrics and graphs such as Spend Charts, Channel ROAS, Response Curves, and Decay Curves. Understand spend share, revenue share, and median ROAS for each channel to make informed decisions.
Model accuracy assessment
Evaluate the reliability of your MMM model using diagnostics like Predicted vs. Actual performance and Model Fit charts. Review metrics like Normalized RMSE and R2 to ensure your strategic decisions are based on accurate data.
Organized metrics and charts
Access all your essential metrics and charts, neatly organized into seven logical tabs. This structure ensures easy navigation and understanding, putting all critical data at your fingertips for efficient analysis.
Quick timeframe switching
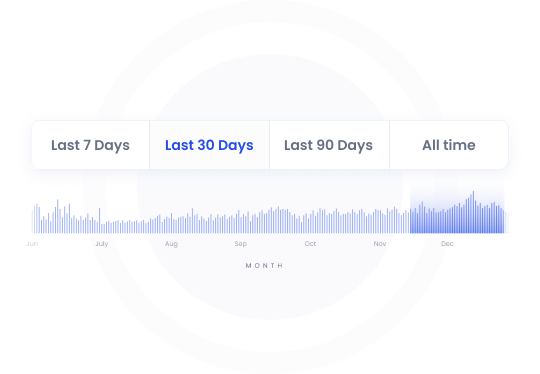
Easily switch between predefined timeframes—Last 7 Days, Last 30 Days, Last 90 Days, or All Time. When you change the timeframe, all graphs and metrics immediately update to reflect the selected period, providing you with timely insights.
Custom zooming in charts
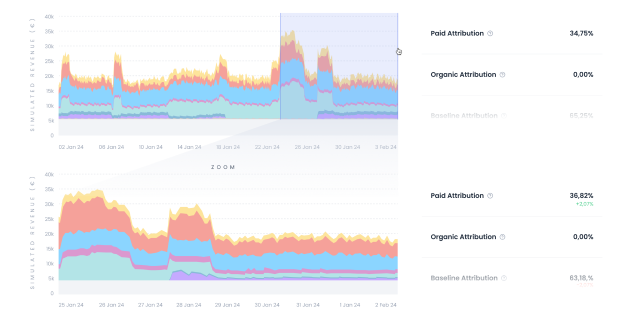
Zoom into any specific time period directly on your charts by selecting the desired range. Analyze targeted events like Black Friday sales in detail, with all metrics recalculated to reflect only the selected timeframe for precise insights.
Events and holidays markers
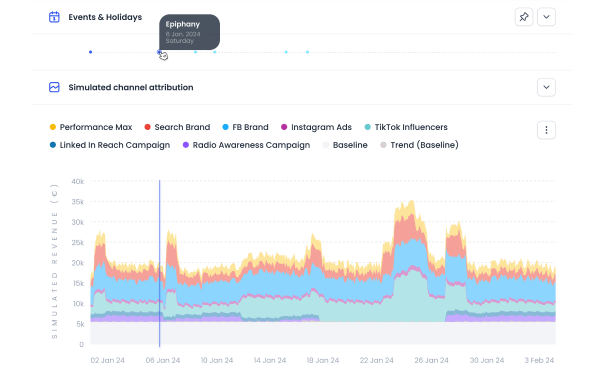
See key events and holidays marked on your time-based charts. Clicking on any marker highlights that day across all charts, allowing you to instantly assess how these occasions influenced your marketing performance.
Flexible data export options
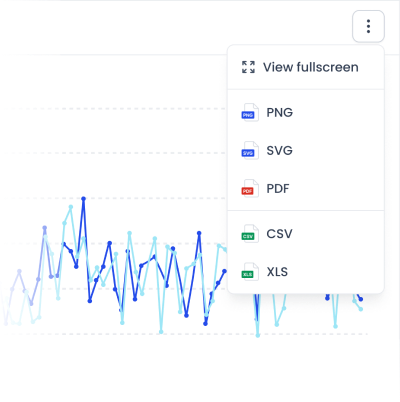
Easily export your charts and data in various formats such as PNG, SVG, PDF for images, or CSV and XLS for spreadsheets. This flexibility enables seamless sharing and further analysis, helping you collaborate effectively with your team.
