
Introduction
GeoLift experiments are a powerful way to measure the impact of your marketing efforts by comparing regions where advertising has been implemented (test regions) with regions where you haven't (control regions). This approach helps you understand the incremental change or so called "lift" caused by your marketing activities. Forvio provides tools to help you run these experiments effectively, ensuring you make data-driven decisions to optimise your marketing strategies.
Key requirements for running a GEOlift test
1. Selecting the right regions - markets granularity
Minimum number of regions: To ensure statistical validity of experiments aim for at least 6 to 8 regions. Sufficient number of regions helps improve the reliability of your results.
Maximum number of regions: While more data can be beneficial, using over 100 regions may become difficult to manage when applying changes into advertising channels. Keep your experiment manageable while maintaining sufficient data for analysis.
2. Gathering historical data
Ideal duration: Use 3 to 6 months of historical data to establish a strong baseline for comparison.
Account for seasonality: If your business experiences seasonal fluctuations , consider using 12 months of data to accurately capture these patterns.
3. Determining test duration
Optimal Length: Test for 2 to 4 weeks. This timeframe covers the entire buying cycle and allows you to capture delayed effects of your marketing, such as ad stock and lag effects. In case you ran an MMM model before, estimated channel lag is is taken into account when recommending test
4. Ensuring consistency during the test
Avoid Confounding Variables: Do not run other marketing campaigns in the test or control regions during the experiment. This will help isolate the effects of the specific marketing intervention you're testing.
Key metrics for success
To assess the success of your GeoLift experiment, it's important to focus on a few key metrics:
Statistical power
This refers to the likelihood that your test will detect a real effect if it exists. We aim for at least 80% power, meaning there's an 80% chance of catching any actual effects.
Effect size
This is about the size of the impact your marketing intervention has, like a 5% increase in sales. For high-volume businesses, a 5% effect is often meaningful, but for smaller volumes with higher deal valued ones, we might look for a 20-30% increase. Knowing this helps design experiments that can pick up on these changes.
Average scaled imbalance
This measures how similar the test and control regions are before starting the experiment. It's key to running a reliable GeoLift test, ensuring any differences seen later are due to the marketing, not pre-existing conditions.
Holdout size
This is the percentage of regions used as control (holdout) regions. The goal is to strike a balance—having a strong control group without sacrificing too much business in those regions during the test, as they might generate less revenue or conversions while holding out.
Experiment recommendation
Running a media mix model before experiments can significantly aid in selecting optimal media channels for causal experiments like geo tests. By creating a standardised data layer in ModelBuilder that maps media channels to revenue—including regional breakdowns—you can analyze criteria such as historical spend, recent testing activity, channel confidence intervals, and expected impact sizes. These insights help identify which channels are most likely to yield meaningful results in causal experiments.
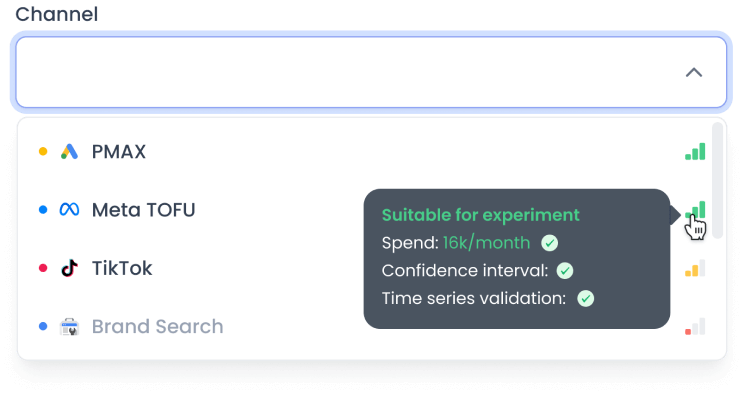 Experiment recommendation, Channel dropdown
Experiment quality score for test configurations
To help you choose the most effective test setups, Forvio calculates an Experiment Score for different configurations. This score combines several metrics to rank the potential setups.
Metrics and weights
Calculating the experiment score
Each metric is standardised to ensure they are on the same scale. The Experiment Score is then calculated using the following formula:
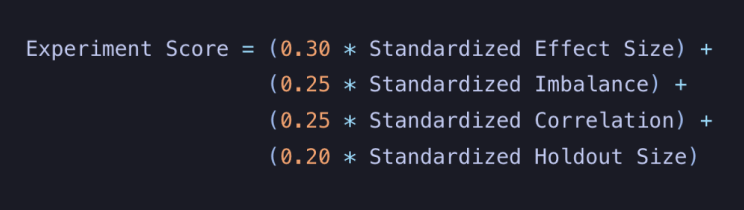 Experiment score formula
Forvio runs simulations using different combinations of regions and durations, then ranks these configurations based on the Experiment Score. This helps you choose the setup that is most likely to yield reliable and meaningful results. Resulting hold out matrix is final outcome of this calculations:
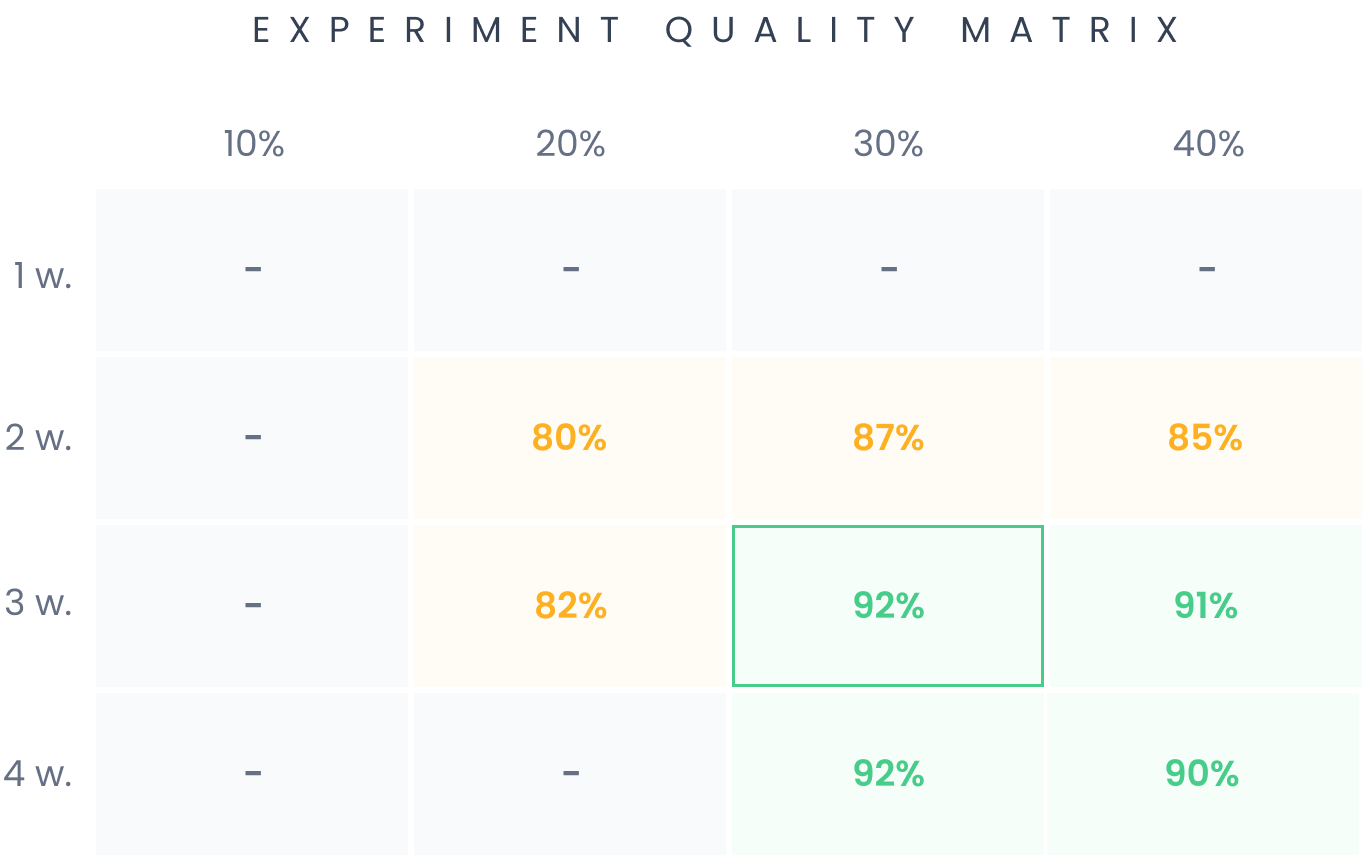 Experiment quality matrix
Experiment evaluation
Analysing results post-experiment
After completing your GeoLift experiment, it's time to evaluate the results to determine the incremental lift—the true impact of your marketing interventions. Forvio detects previous experiments automatically and offers possibility to evaluate those past historical experiments
Understanding incremental change
Incremental Lift: The difference in outcomes between the test and control regions that can be attributed to your marketing efforts.
Goal: Quantify the true impact of your marketing to inform future strategies.
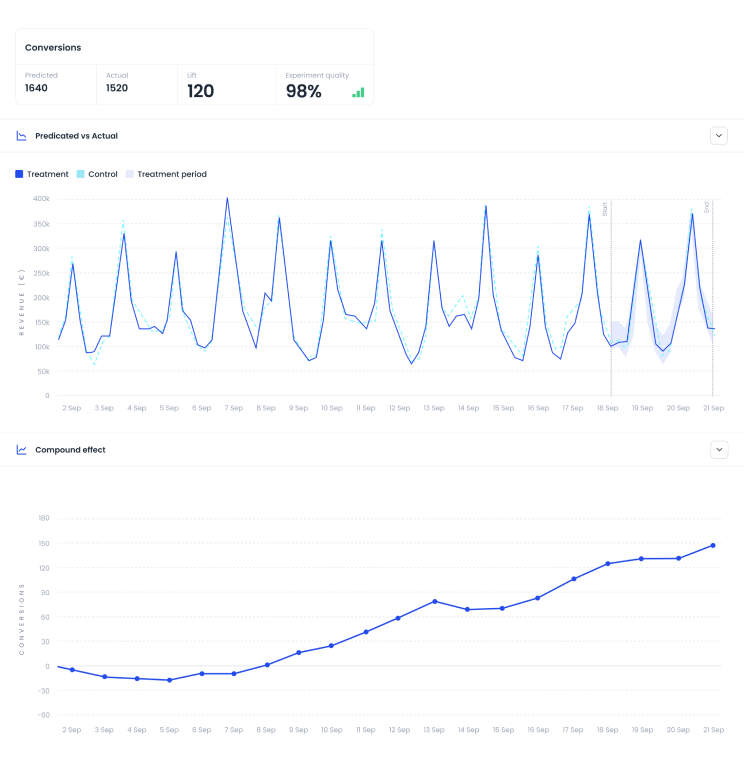 Geo lift test evaluation
Methodology for Evaluation
To accurately assess the incremental lift, Forvio employs advanced modelling techniques
Using historical data for robust models
Longer pre-treatment periods: Utilizing more historical data helps create robust models that can more accurately forecast what would have happened in the absence of the marketing intervention.
Balancing act: While more data can improve model reliability, it's important to account for factors like changes in market conditions over time.
Advanced modeling techniques
Model Comparison: Multiple various models are tested , and their performance is evaluated based on statistical criteria such as goodness-of-fit and predictive accuracy. Forvio automatically selects the model that best fits your data, ensuring that the estimated lift is both statistically significant and practically meaningful.
Next steps
Plan Your Experiment: Use this guide to outline your GeoLift experiment, making informed decisions at each step.
Utilize Forvio's Tools: Leverage Forvio's simulation and analysis capabilities to optimize your experiment configuration.
Interpret Results Carefully: After the experiment, analyze the results using the recommended methodologies to draw accurate conclusions.
By following these guidelines, you'll be well-equipped to measure the true impact of your marketing activities and make data-driven decisions to enhance your strategies.
