Data landscape
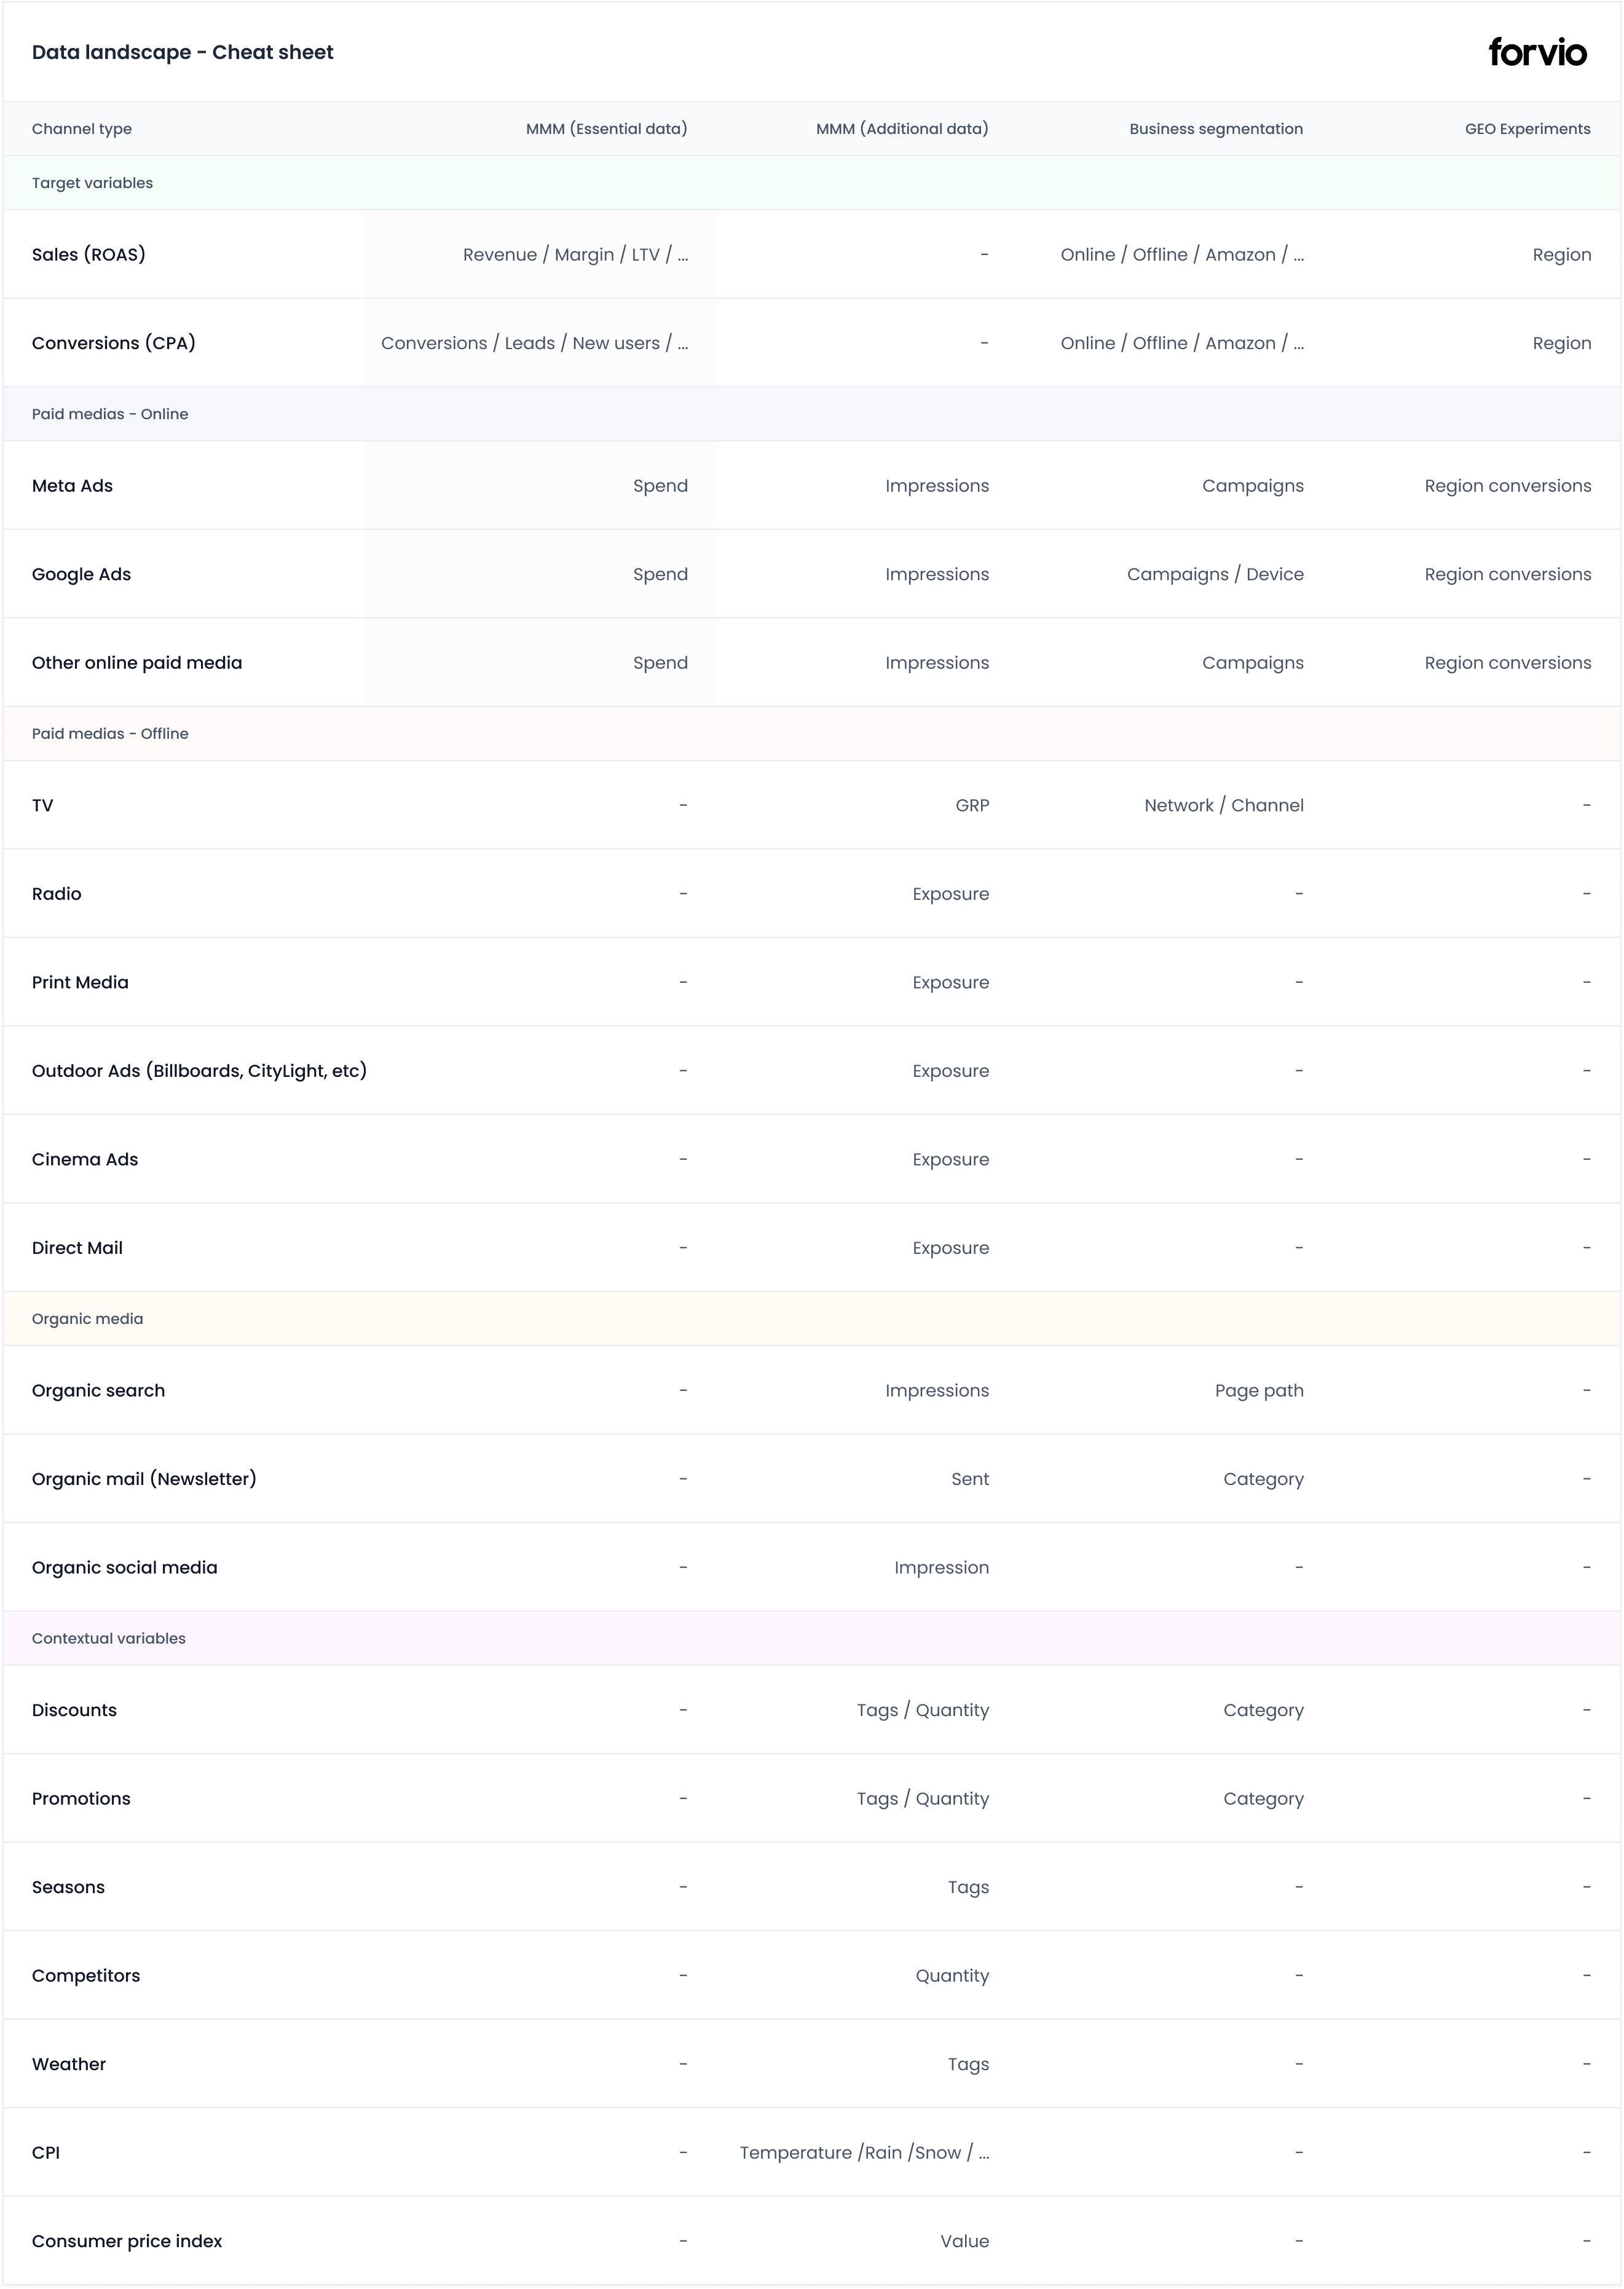
This section illustrates which data are needed to successfully operate Forvio measurement platform. The following cheat sheet presents various data categories from essential ones like marketing spend and target variables representing business KPI to be modelled to additional data which can improve models. Typically, those are contextual data. This vocabulary demonstrates the range of data that can be included in Forvio to more use all features and functionalities accurately reflect real-world scenarios.
Cheat sheet

 Forvio Data Landscape Cheat Sheet
Data for MMM
Marketing Mix Modeling can incorporate various types of data to provide comprehensive insights. Below is a list of data types that can be included, with the necessary minimum data highlighted.
Essential data (minimum required)
Historical sales or other relevant KPIs
- Daily data on sales revenue, units sold, website traffic, or other relevant key performance indicators.
Marketing expenditures
- Daily spend in each paid marketing channel you wish to analyze (e.g., TV advertising, online banners, PPC campaigns, social media, radio, print media, etc.).
We recommend at least last 24 months of data at the day level, minimum models are 6 months of data where year-on-year seasonality would not be captured.
Additional data (optional but recommended)
External factors
- Data on factors that may influence sales but are not directly related to marketing, such as weather conditions, economic indicators, competitor activities, holidays, and similar variables.
Pricing and promotional data
- Information on price changes, discounts, and promotional campaigns that may affect consumer behaviour. This needs to be on daily level either by simple having on or off indication or quantifying discount amount and category.
Including the essential data allows you to build a foundational MMM model. While the additional data are not mandatory, incorporating them can enhance model accuracy and provide deeper insights into factors affecting your marketing performance.
Points to consider
Use campaigns to categorize channels
- Utilize campaign data in filters to effectively categorize and organize different marketing channels.
Leverage impressions to analyze Spend vs. Effect
- Model is using Spend data only but including impression metrics allows Forvio to assess the relationship between marketing spend and its impact on target outcomes. There is warning if this relationship is not linear signalling bigger changes across timeline.
Track conversions for comparative analysis
- Optional metrics. Conversions/Attributed Sales are used for comparing side by side MMM estimated ROAS/CPA with your own or platform based touch based attribution.
Automatic currency conversion
- Forvio provides fully automatic currency conversion so it is important to properly tag data sources to facilitate automatic currency conversion, maintaining consistency across financial data.
Additional data for GEO lift experiments
When conducting GEO Lift Experiments, it is essential to include data segmented by regions. We recommend granularity between 20 and 100 regions. Specifically, you need to:
Include regional splits in advertising channels
- Provide data that is divided by geographic regions where your marketing activities are taking place. This includes regional identifiers for all relevant datasets.
Track conversions per region
- Collect and include conversion/sales data for each paid channel, broken down by region.
This ensures that the impact of marketing efforts can be accurately measured in each specific area. Incorporating spend regional splits and regional sales/conversion data allows for precise analysis of marketing effectiveness across different geographic locations. This granular approach enhances the accuracy of GEO Lift Experiments and provides deeper insights into regional performance.